Year End Report to Clients for the period ended December 31, 2018
Most investors are glad the year 2018 is past. It was one of the most volatile in a decade, and some believe we have seen the end to a historic ten-year bull market that rose Phoenix-like from the panicked days of the Great Recession of 2007 – 2009. Equities, whether U.S. or international offered no place to hide, particularly in the last quarter:
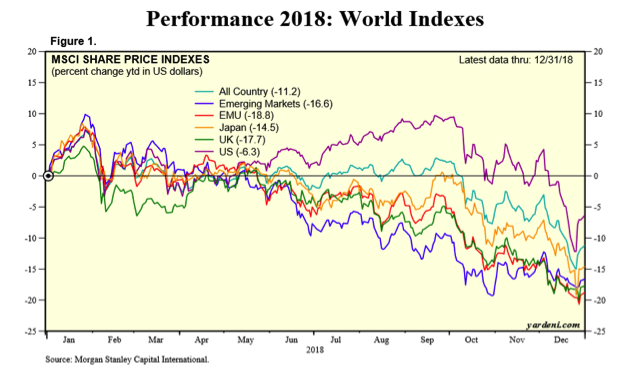
This year’s 5.63% loss for the Dow Jones Industrial Average was not extreme when compared to bear markets, but in the context of a strong ten-year record, it came as a jolt.

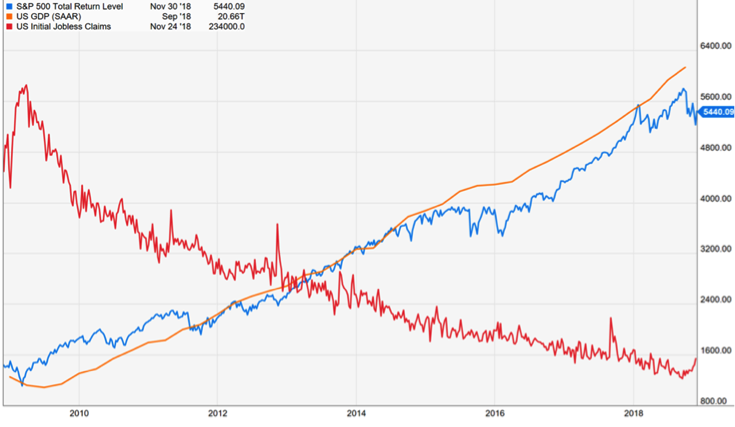
There was no one identifiable catalyst for this broad sell off. True, leading indicators suggest a slowing world economy, but “slowing” is not the same as contracting, the definition of a recession. Unemployment, especially in the USA is at historic lows, and consumers appear to be confident and out buying, dining and enjoying rising wages. It seems things should be booming, but perhaps the boom has already been priced into the markets.
Here is a cheery chart showing several important economic indicators:
Yet economists note that global leading indicators have turned down:
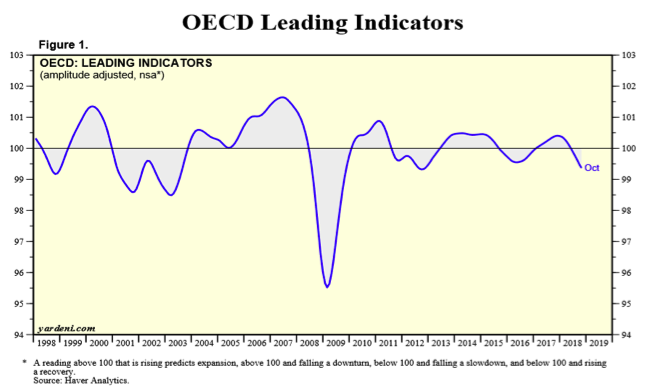
Source: Yardeni.com
We have seen slowing of a similar degree a few times during the past ten years, and yes, this slowing was accompanied by correcting stock markets[1]. Will the current dip be but a correction, or are we now falling off a precipice?
The global economy has been feasting on cheap credit, low interest rates and accommodative central banks since the turn-around (2009 for the United States, 2010 -2011 for most of the rest of the planet). At the first suggestion, in Spring of 2014, that the world’s central bank, the U.S. Federal Reserve would begin winding down “quantitative easing”, a “taper tantrum”, resulted in bond yields rising and a stock market correction. The Fed backed off and thereafter, it moved more carefully. As economic momentum gained further steam the Fed under Janet Yellen was in fact able to gently remove much of the extraordinary monetary life support it had extended to the economy without creating too much stress. But a crash in the oil patch, a major American industry, made it difficult for the Fed to “normalize” its balance sheet. Yet, it is noteworthy that as central bank expansion activity has begun to reverse, the U.S. and other equity markets are struggling:
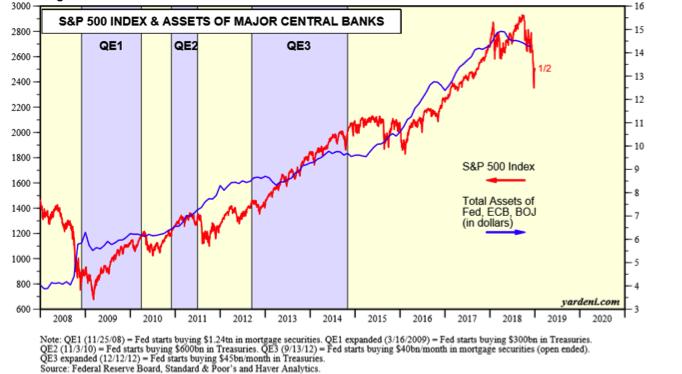
Source: Yardeni.com
Just as central banks were taking their feet off the monetary gas pedal, the election of Donald Trump and an all-republican Congress brought the prospect of lower corporate taxes and deregulation: equity investors piled in and the stock market enjoyed another up leg from November 2016. As widely predicted, gross domestic product in the US rose last year to about 3%. Many companies, incented by the new tax law, brought $BB back to the USA and used much of that money to buy in stock and raise dividends. This was “all right” by investors. But this “sugar high” seems to be abating. Today, with no prospect of further fiscal stimulus and a Fed determined to get its balance sheet back to normal, and with the prospect of a tidal wave of Federal borrowing in 2019[2], the market is fearful of soaring interest rates.
When rates rise, cautious money tends to avoid or even leave the stock market and find a home in certificates of deposit in banks. This process began this year, especially in the quarter just past. In fact, many of our clients were moved to short term instruments, pending clarity as to the direction of equities. Further rate increases and/or stock market weakness could accelerate this process. We are not predicting this, but it is a tangible risk.
Yet it is difficult to see a recession, when people are working longer hours, there is a labor shortage and the United States is now the world’s largest oil and gas producer, pushing down the cost of energy – a form of tax cut on industry and consumers. The farm sector is a bit of a worry due to tariff brinksmanship that has caused China to seek alternatives to U.S. grown soy beans, but so far overall agricultural exports are not down significantly. While it is unclear how drastic a tariff war may become, history is not kind to nations that engage in retaliatory tariffs. The Great Depression was, many believe, largely the biproduct of the Smoot-Hawley tariff legislation of 1930. Judging from the lobbying by many U.S. businesses, free trade, embraced by Republicans before Trump, is a net positive, at least for investors, if not for workers. As this is written, Apple has warned of a sharp decline in predicted iPhone sales particularly in China, where it may be patriotic (or wise) to avoid non-Chinese brands.
As presented in other forums, we are intrigued by a chart that shows the Dow Jones Industrial Average, adjusted for inflation. Consider the graph of the Dow since 1921:
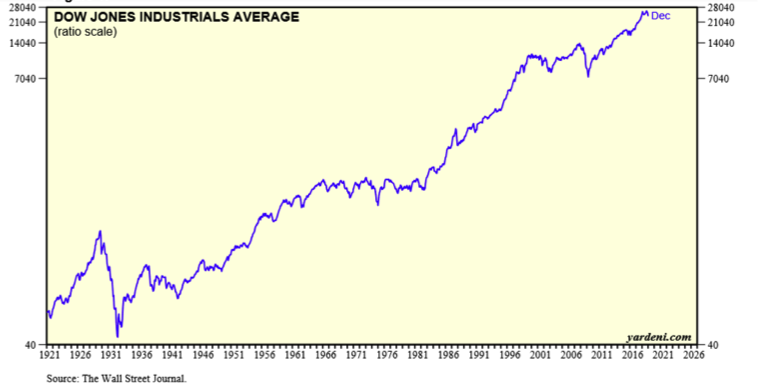
From a low of about 50 in 1921 the market has advanced, albeit with some nauseating bear markets, to the current level of about 23,000. Please recall that inflation distorts pricing for everything. A good salary for an educated engineer in the 1920’s might have been about $3,500 per year[3]. A ladies’ dress could be had from the Sears catalogue for under $10.00. The dramatic increase for stock prices

is thus a bit less impressive when lost dollar buying power is factored in. What does the Dow look like when adjusted for inflation?
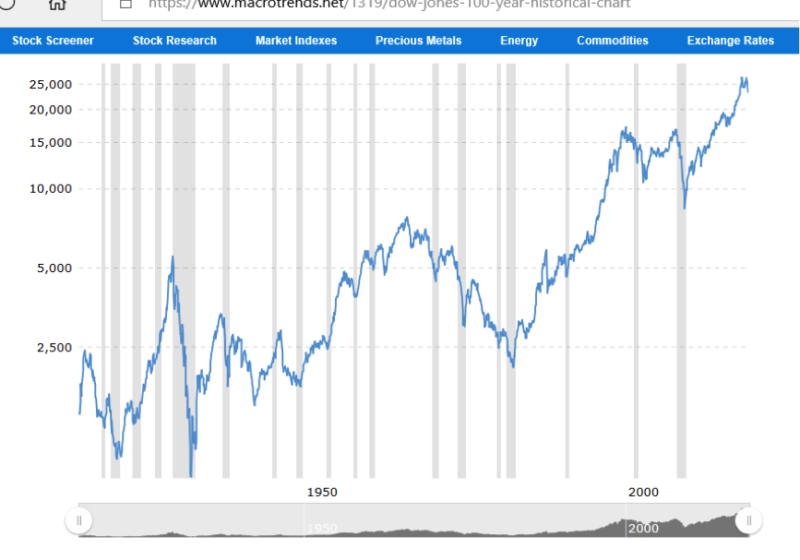
Source: Macrotrends.com
The gain is still impressive, and if one could invest with a 95-year time horizon, it seems even after inflation, an impressive compounding of wealth would result. The inflation adjusted Dow may be useful in marking truly important market moments, while filtering out buying power distortion. We have had a possible example in our young century: when adjusted for inflation, the new all time Dow high seen in late 2007 was merely a return to the high achieved at the end of the great bull run from 1982 to 2000. The Dow did not see a “real” new high until mid- 2014- nearly a 13-year hiatus. That’s a long time to tread water. So, the ability of stocks to breach a “double top” (2001 and 2007) was, for market technicians, a harbinger of great things to come. It may suggest we are in the midst of a “secular” bull market for U.S. equities. Still, it has been four and one- half years since this important technical milestone was achieved, and the recovery from the Great Recession has required ten years of record low interest rates for support.
Charts are not necessarily predictive. The world is a place of imponderables and ever- changing scenarios. Diversification remains the only intelligent approach to investing.
Here are some of the thoughts worrying the market as we enter 2019:
- Expectation of further interest rate increases
- End of further tax relief for business
- Europe in slowdown mode
- China Slowing
- Concerns about U.S. position on international stage (Middle East, N. Korea, China, Russia)
- Possibility of impeachment recommendation from House of Representatives
- De-FAANGing of the markets
The last bullet point is worth considering. The U.S. markets and arguably global markets have been led by popular technology companies (Facebook, Apple, Amazon, Netflix and Google) that have been monetizing the promise that drove the Technology Bubble of the late 1990’s. Folks were in love with the potential for technology-based wonders and invested with optimism during the Bubble. But there was a time lag between conception and realization. As beloved technology companies failed to turn vision into immediate profits, the over-valued market collapsed between 2001 and 2002. This pattern has an historical precedent. A practical electric light bulb was developed by Thomas Edison and his associates in the 1880’s but his companies and those formed by George Westinghouse could not realize their full economic potential before investing enormous sums to make electricity widely distributed and light bulbs (and electrical motors and appliances) affordable to the masses. This took decades. Vast profits were generated but not all companies succeeded and there were fits and starts along the way. Mid-way through a battle to decide if Direct Current or Alternating Current would win the day, Westinghouse nearly went under during a financial panic in 1890. Edison was pushed out of Edison General Electric in 1892 by financier JP Morgan. Electrification of the rural United States was still ongoing into the 1930’s.
As with electricity and the myriad benefits of an electrified world made possible by distribution of power from central plants, we live in an age where great minds are refining and molding the network of widely distributed, instant information (world wide web). Today we are transitioning from data stored on in-home or in-firm computers to centralized data storage (“the cloud”). While most ordinary folks shake their heads at the good (and evil) made possible by instantaneous linkage of the world’s population via social media, others find investment opportunities therein. As with previous investments based on revolutionary advances in science, there are fits and starts. There is no guaranteed easy road to riches.
Today there are threats to investors who own technology companies: we appear to be at a stage where governments are determined to regulate and tax use of the internet and the companies that profit from its existences. Amazon’s refusal to collect local sales taxes was an early and obvious target, and the company has been forced to submit to becoming a tax collector by many jurisdictions in the past decade. There are now some rumblings about the evils of the Amazon Monopoly. Facebook and its willingness to sell data about its subscribers is under suspicion in the United States and Europe, likewise with Google. European authorities are bolder about taxing the companies since they are not based in Europe, and “America First” talk may be giving other nations justification to go after U.S. technology giants. Twitter has often been the tool of enemy states seeking to direct US elections or policy. As in the past, public safety is the motivation and excuse for the hand of regulators and taxing authorities to reach into the pockets of technology investors. While there may be some justification for government intrusion, this shifting regulatory landscape may cause investors in FAANG stocks to be nervous and take profits. As with past sell offs, those companies most loved and most valued now weigh most heavily on capitalization weighted indices. This behavior is periodic, normal and to be expected. The timing of stock market corrections, however, is not easily predicted, which is why we keep our investors diversified at all times.
Fixed Income
The prime diversifier to balance against stocks is through purchase of bonds and preferred stock. Rather than profit from corporate growth, these “fixed income” instruments, direct loans, benefit from a promised or guaranteed stream of income, with no expectation for price appreciation. These are nearly always senior securities, with a greater call on the resources of a corporate issuer than common shareholders enjoy. These investments generally have lower volatility and their cash flow tends to reduce portfolio fluctuation.
The bond market is huge and there are many variations: traditional fixed rate bonds, floating rate, high grade, high yield, bank participations and private leveraged loans. In some cases, our clients have been placed directly into bonds, in other situations we have felt that mutual funds or exchange traded funds offered more diversification and another layer of professional management.
Often, however, bonds weaken in price when interest rates are rising, as a precursor to a stock market correction. So, it was in 2018. Charles Schwab’s website sums it up rather bluntly:
“2018 was a forgettable year for many corporate fixed income investments
Most corporate fixed income investments delivered disappointing total returns in 2018. A combination of rising Treasury yields coupled with rising spreads resulted in lower prices for most fixed income investments. A credit spread is the additional yield a corporate bond offers relative to a comparable Treasury note. Since spreads are a component of yield, rising spreads can push prices lower. The average price of every corporate fixed income index we track is lower today than where it started the year.” (Source: Schwab.com)
While the bond portion of client portfolios may have been unable to offset stock declines, their low volatility fulfilled the role of dampener in 2018 and fixed income, usually at a greater percentage yield than from stocks, has continued to flow into accounts on a regular basis.
As holdings for clients have been reduced, much of the money realized awaits reinvestment. “Cash” is not the same dead space it has been for most of the past decade. Overnight money fund rates are close to 2%[4]. We do not consider money market funds to be a sensible long-term investment strategy, but they are a viable place to earn some income, until longer term commitments can be made at what may prove to be bargain prices.
Below is a summary of some holdings for clients. Each client situation is unique, so not all clients hold these items, or may own them in different proportion to others, depending on our understanding of your objectives.
Fixed income investments
Baby Bonds
What are Baby Bonds? Like regular bonds, they are traded on the stock exchanges instead of the dealer-to-dealer bond markets.[5] Investors can buy and sell them just like stocks. Many baby bonds carry maturities of 30 years or more, although some have maturities of just 5-10 years. Most of these securities make interest payments on a quarterly, rather than a semi-annual basis. Baby bonds are issued in relatively small tranches and are “junior” to the issuing company’s secured debt but senior to preferred and common shares. Most of the issues have a $25.00 par value and are callable at $25.00/share plus accrued interest, usually some years before the maturity date. Debt issues, including baby bonds, tend to have low price volatility and can normally be sold anytime. Most baby bonds pay higher interest rates than their regular bond counterparts (for the same type of risk) because institutional investors do not buy them, and many retail investors are not aware they exist. Because trading volume is relatively low, yields are extraordinarily high to attract buyers.
Here is an example of a typical baby bond and its characteristics as of November 30, 2018:
Senior Housing Properties, rated BBB, current yield 6.51%
Preferred Stock
There are many similarities between “baby bonds” described above and preferred stock. Both trade on stock exchanges and have a par value of $25.00 per share. Both pay higher income rates than other instruments of the same institutional quality level, because they are issued in relatively small amounts, therefore cannot be held by large institutional investors such as insurance companies and pension funds. Further, the retail investing public is not generally aware of these instruments. In short, there is less competition to buy these instruments, so they pay higher interest rates to attract investors. We use these interchangeably with baby bonds, choosing those with the most attractive combination of yield and quality.
Here is an example of a preferred stock and its characteristics as of November 30, 2018:
Bank of America Series B, rated BBB, current yield 5.95%
Equity Holdings
Amazon.com
Amazon trades at high multiples, does not pay a dividend, and is rather tight lipped about its various business operations. Nevertheless, under the direction of hard-charging Jeff Bezos, the company has succeeded at almost every business it pursues.
It would be difficult to delve into every facet of the company’s business here, but it’s worth highlighting some of the most exciting drivers. It is of course known as the online retailer that has come to dominate online shopping and disrupt sticks and bricks retailing. Like Costco, the company embraces a subscription model, Amazon Prime, which has smoothed income flow and has proved extremely “sticky” in generating member loyalty. Free shipping and an entertainment service that rivals Netflix are attracting and holding Prime subscription membership. Last year the company raised the annual cost of Prime from $99 to $120 with barely a protest from subscribers. Less well known is the rapid growth of a high margin business known as Amazon Web Services a cloud service which rents space on Amazon servers to developers, communications companies, financial businesses and many more. Amazon is the leader in “cloud” hosting. Another area of rapid growth for the company is online advertising. Increasingly, shoppers surfing Amazon find certain products placed prominently on the first landing page, thanks to pay-for-placement. While Google is best known for this and Facebook is likewise a powerful force in online advertising, Amazon, with its huge online draw is increasingly selling online real estate and earning fat margins in the process.
The company is also an international power house and now has over 17 websites globally and in a variety of languages. Their principal challengers are Alibaba and Tencent, both Chinese companies. Given friction between the United States, Western countries and China, it appears Amazon will remain a highly competitive player, at least outside of China.

A consensus of 44 financial analysts covering the company predict an average sales growth rate of 20% in 2019. Goldman Sachs has Amazon on its “conviction buy list” something awarded to only a handful of stocks.
American Tower REIT (AMT)
This is a real estate trust that owns tens of thousands of towers vital to relaying cellular voice and data, AMT is the largest such entity in the world. About 2/3 of its profits derives from the USA while the balance is from rapidly growing countries like Brazil, Mexico and India. Simply put, the company leases space on its towers and cell sites to communications providers such as Verizon, AT&T, Sprint and T Mobile. In 2017 American Tower purchased nearly all Verizon-owned towers. Once in control of a single use tower, AMT can “collocate”, that is, lease to other carriers, and thus double, triple or quadruple revenue from the same tower.

This is a high margin business with a reliable repeating stream of rental income. As anyone using a cell phone in the US knows, dropped calls are not infrequent. To remain competitive, carriers need to continually expand and improve their coverage. This drives ongoing demand for space on towers.
Data transmission has become the dominant use of cellular networks and is exploding. With the advent of 5G technology, it is expected that the revenue to be generated by AMT’s towers will grow at a similar pace. Also, chief competitors Crown Castle and SB Communications are doing well, but it appears that they are unlikely to steal business from American Tower as the entire industry is expanding rapidly and there appears to be plenty of “pie” to go around.
A possible challenge to AMT will be a merger of Sprint and T Mobile, if allowed by the government. This could lead to less competition and allow the three remaining carriers to negotiate slower rent increases. Further some of the towers owned by American Tower are lodged on leased land, and each year some of these leases mature and must be renegotiated. The cost of such leases will undoubtedly rise. Still, my reading of the strong growth in this industry suggests that even with such risks, the price and dividend from this company will grow over time.
Berkshire Hathaway
Berkshire is effectively a well- managed diversified group of companies under the direction of Warren Buffet and a group of able managers. The company owns businesses providing insurance, railroading, ice cream, furniture and clothing to name a few. The key to its success is the generation of large amounts of free cash flow (AKA “float”), especially from its insurance subsidiaries (GEICO, Berkshire Reinsurance). This money is then successfully redeployed and redeployed again.
While the company does not pay a cash dividend, it appears to be on a path of repurchasing shares, as it has to date in 2018. This will, I believe protect shareholders from any major sell off, in the event of a bear market. This is evidenced by its resilience in the face of a 4th quarter 2018 correction.
Cincinnati Financial (CINF)
Based in Ohio, Cincinnati Financial has grown steadily since the late 1940’s. My sense is that management still embraces midwestern values and is methodical in its approaches to underwriting, expansion and financial management.
Its primary business is insurance, especially property and casualty insurance. A superior underwriter, CINF has dodged most of the weather disasters that have afflicted the Gulf of Mexico states. It operates in an old-fashioned way, through belly-to-belly selling by appointed agents. The company has raised its dividend for 58 years in a row. With great consistency, the company sports a “combined ratio” (losses to income) below 100% meaning it has been consistently profitable. Further, the company has generated important financial ratios such as returns on average assets well above industry peers. The only knock on the company is that 80% of its assets are in equities and less in bonds and in real estate when compared to peers. Should a major bear stock market hit, the company could be vulnerable. Still, it has managed through many bear markets, including the debacle of 2007 to 2009 while still raising its dividend. Unlike better known insurers, like AIG and Prudential, the company never sought a bailout from the government.
Like Berkshire Hathaway, Cincinnati Financial generates a good deal of “float” or free cash flow on a regular basis. This money has then been successfully deployed in the purchase of bonds and stocks. To my mind this company is like a Berkshire Hathaway that pays a current dividend.
Digital Realty Trust (DLR)
Trading at only 2.5 times book value, this is a REIT that operates data centers, AKA “Cloud farms”- large buildings that house mainframe computers that in turn house and relay data around the world wide web. With information rapidly relocating to “the Cloud” from desktop and local storage, this is one of the most exciting mega trends in technology. Yet DLR is a bread-and-butter real estate operator. Their data centers can be compared to major rail yards, where freight enters and is redistributed to other carriers and sent in new directions or is stored in nearby warehouses temporarily before re-shipping.
The main job of DLR is to make sure of 99.999% operational reliability. Teams of well-trained technicians are on site 24/7 to maintain uptime. Cooling is a major job as mainframe computers generate enormous amounts of heat. DLR’s colocation facilities have redundant source of electricity to assure reliability.
A major client of DLR is Microsoft whose Azure Cloud offering is growing apace and is now number 2 in the world (see discussion of Microsoft below.)

Dominion Energy (D)
A Diversified utility with an attractive dividend and significant upside potential.
Based in Richmond, Virginia and serving one of the faster growing parts of the USA, Dominion Energy is an integrated energy company, third largest in the United States, with approximately 27,000 megawatts of electric generation capacity; 15,000 miles of natural gas transmission, storage, distribution and gathering pipelines; and more than 63,000 miles of electric transmission and distribution lines. While still primarily an electric generator, Dominion operates one of the nation’s largest natural gas storage systems and successfully completed the only LNG export facility on the east coast, now operating at capacity (Cove Point. The company is also 48% owner of the proposed Atlantic Coast Pipeline, but that project has faced delays.
About half of Dominion’s profits derive from regulated energy transportation and storage, and most of its operations enjoy favorable regulatory jurisdictions and reliable cash flow. This means they are a high-quality credit and able to manage financial needs (borrowing or equity issuance) with ease.
Financial metrics for this company suggest that it stands on sound financial footing. While its profit margin is the highest in 6 years, its price to earnings ratio is close to the lowest in six years. Further, the company is currently offering a dividend yield of 4.6%, a dividend that appears safe.
After suffering significant price erosion earlier this year, due to a combination of negative but transitory events, the stock has recovered most of its sell off, and seems very reasonably priced to me.
Utility stocks, popular with income investors have been under pressure this year when it seemed clear that the Federal Reserve planned to allow ambient interest rates to return toward more normal, higher levels. With the end of Quantitative Easing, and recent tax and spending legislation that will vastly increase Federal borrowing, investors are concerned that interest rates could rise sharply, providing competition for dividend paying utility stocks such as Dominion. Given the market’s reaction to both Fed rate increases and chaos in government, given the fears over trade wars and a slowdown in foreign economies, there is now some talk that the Fed is done increasing rates and that they may even be forced to reduce them again. Either way, the underlying business of Dominion appears to be sustainable and I believe investors consider this a “must own” utility company.
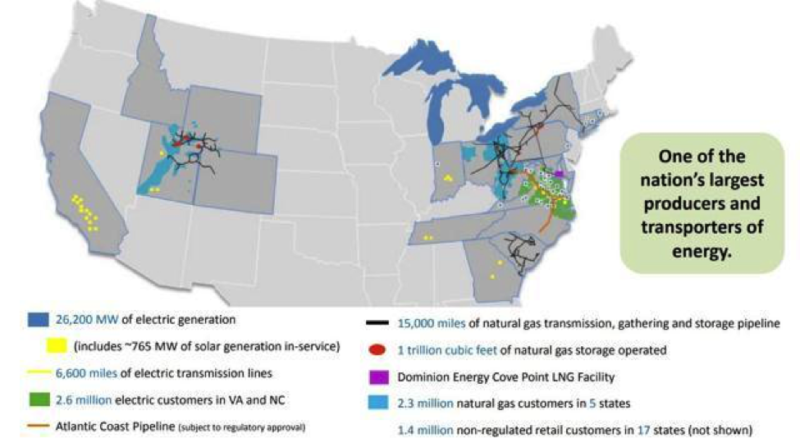
Source: Dominion Resources
Enterprise Product Partners (EPD)
The graph below pretty much summarizes why this security, held in client accounts for a decade, is so attractive:
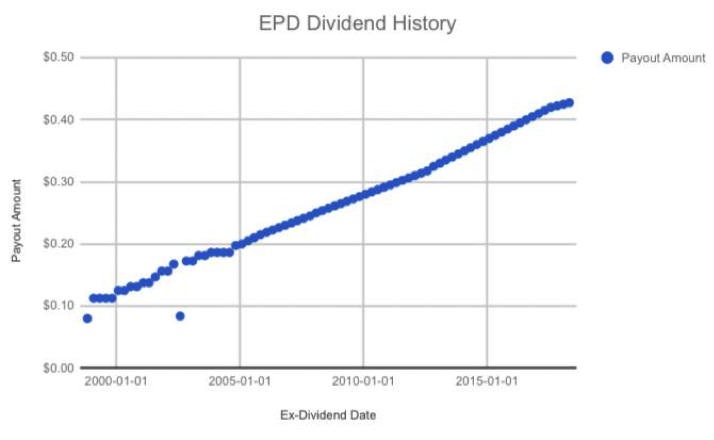
The above is a history of dividend payouts, rising almost without interruption since 2000. The stock currently yields over 6%. Enterprise is the largest energy gathering and storage operation in North America, with pipelines reaching into the three largest natural gas producing regions. 87% of their income is derived not from drilling or production, but from simply transporting, storing and refining petroleum products, primarily natural gas and natural gas liquids.
The United States is once again the world’s largest energy producing nation thanks to the technological breakthrough in the early 21st century known as hydraulic fracturing (AKA “Fracking”). There is a surplus of natural gas that seeks markets. New chemical plants have been and are being built at a rapid pace to take advantage of high availability of raw material. Gas well production needs to get to market and often needs to be broken into component base gases or liquids through “fractionation” a form of refining. Enterprise has invested $billions over the past eight years or so to accommodate this demand and is reaping a high level of profit from it.
However, many investors, particularly those using energy exchange traded funds, confuse EPD with oil and gas producers such as Occidental Petroleum or Chevron. With energy prices under pressure, Enterprise’s price is, in my opinion, erroneously undervalued. This presents therefore the opportunity to earn outsized dividend yields and upside potential.
Microsoft (MSFT)
Still the dominant force in software (world’s largest), Microsoft’s growth stagnated under Steve Ballmer, who missed the mobile phone revolution then tried to catch up with an ill-timed purchase of Nokia. The story improved when Satya Nadella became CEO in 2014. The company has unashamedly imitated Apple in creating attractive retail outlets to demonstrate products and provide competent technical help at its Answer Desk. I suspect this is stemming the tide of defection to expensive Apple hardware, while even retrieving clients from Apple.[6]
The big growth story has to do with its embrace of cloud computing. The company’s focus on a “mobile-first, cloud-first” strategy has contributed significantly to overall growth acceleration led by the Intelligent Cloud segment, with strong adoption of MSFT’s Azure platform, a cloud hosting service that is challenging Amazon Web Services for dominance. Analysts note growth-oriented acquisition activity, with the LinkedIn purchase in 2016 and the pending buy of software development platform GitHub for June 2018 (for $7.5 billion).
I’m heartened by the steady conversion of legacy “Windows” software to an annual subscription platform. All the software for which Microsoft is famous: Word, Excel, PowerPoint and more keep business and retail consumers on the platform paying a fee every year. This smooths income and creates the “subscription” model I find attractive. Return on equity of 22% is one of the most impressive in the tech space and amazing for such a mature company.
The company is a regular repurchaser of its own shares and owners have enjoyed healthy dividend increases. MSFT bought back more than $10 billion in stock each of its last four fiscal years (ranging from $11 billion to $16 billion annually.) I believe there is more to come for patient investors.
Rollins Corporation (ROL)
America’s largest pest control company is a name that may not be as familiar as two of its local brands, Orkin and Orange County Pest Control. Although not widely covered by large brokerage company analysts, Rollins has been listed on the New York Stock Exchange for half a century. The attractive aspect of this company is recurring subscription-like revenue, a “sticky” business enjoying a high level of a current, repeat income. Revenues are derived about evenly from residential and commercial pest control services. There are usually contractual ongoing engagements that entail regular weekly, monthly or bi-monthly visits to the premises. Management is acutely aware of providing prompt and responsive service. They also appear to be at the cutting edge of technology to allow their technicians to cover more territory per day than in the past and to allow more time for selling to new prospects. The company is also growing by acquisition: most pest control operations here and in Canada are owned by local operators who may be aging baby boomers looking for a financial exit strategy. In an acquisition, there may be tax advantages to the seller for accepting Rollins stock in exchange for its own, or the transaction may be for cash. Rollins’ size and reputation gives it a competitive attraction for a seller. Typically, after a sale, Rollins keeps the local operator’s people and the company name, in order to take advantage of the good will already established by a local operator over decades.
[1] Leading indicators include stock indexes, so when markets fall as they have been, it is no surprise that “leading” indicators follow. Yet as the late economist Paul Samuelson has noted, the market behavior has predicted nine of the last five recessions.
[2] Estimates are that the corporate and individual tax cuts that went into effect in 2018 will reduce Federal revenue by over $1,000,000,000,000 (trillion) over the next few years. Believers in supply side economics scoff at this estimate, believing a booming economy will create offsetting tax revenue.
[3] Source: Bulletin of the United State Bureau of Labor Statistics #682, 1941
[4] Overnight money funds must be purchased and sold-they are a mutual fund. This contrasts to money market “sweep” funds which have considerably lower yields.
[5] Unlike standard bonds, there is no adjustment for accrued interest between buyer and seller – bid ask spreads on the exchange embed this adjustment.
[6] Full disclosure- I, an Apple owner for years, purchased a Surface Pro netbook in early 2016 and am a fan.