Below is a graphic borrowed from the Wall Street Journal online, tracking equity performance both here and abroad for the year to date, as of September 30, 2020:
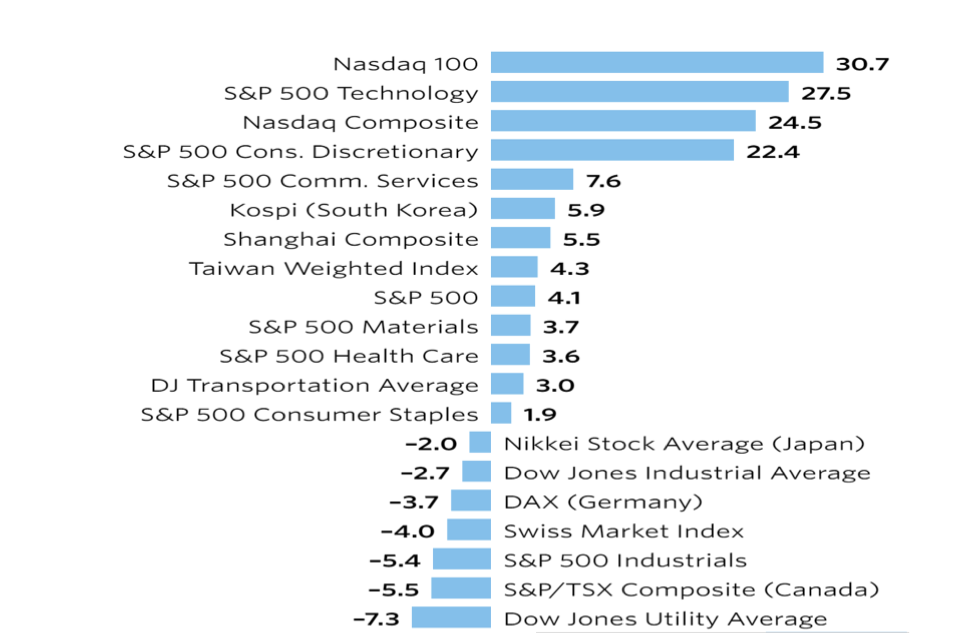
As this quarter wound down, unemployment is above 8 percent, the federal deficit as a percentage of GDP is the largest since World War II, and the U.S. death toll from COVID-19 is over 200,000—yet markets are near or above their pre-pandemic peaks. Amid all this turbulence, one of the most anticipated elections in modern history is less than five weeks away. How should investors respond to so much unprecedented social, economic, and political uncertainty?
It appears that human ingenuity, employing technology, is allowing a more rapid return to normal life than anyone anticipated five or six months ago. While this is a more uncertain time than usual, there are many positive indicators about:
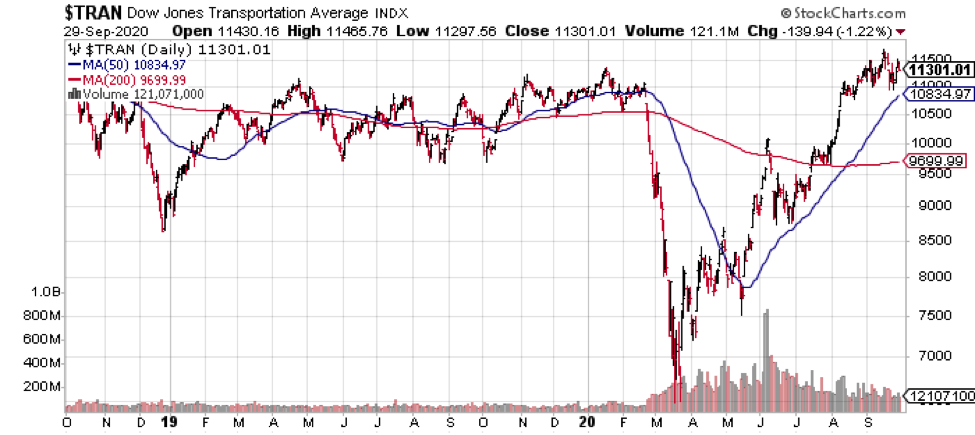
Transportation stocks suggest there is momentum in the economic rebound, the Dow Transport index turned in a 22% gain, more than erasing its losses from earlier in the year. It also appears demand is recovering for many sectors, especially housing, thus the need for goods to move by rail, truck ship or air.
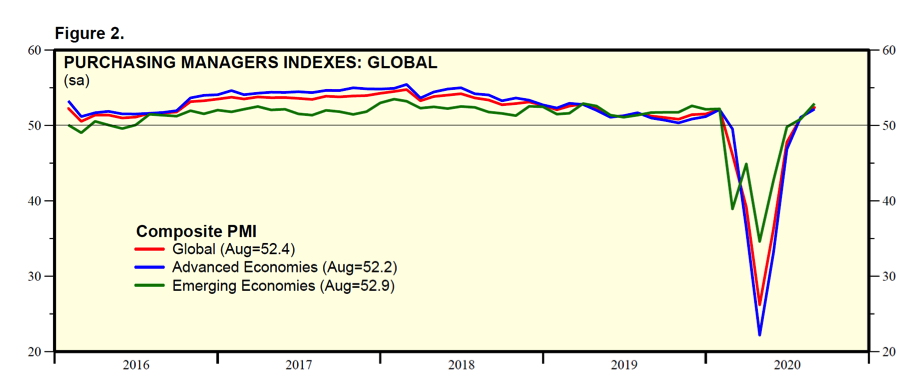
This positive indicator seems confirmed by an unexpectedly strong rebound in “purchasing managers indices”, a survey of industry expectations for business (note these are global, not just USA figures):
In the U.S., in the absence of further fiscal stimulus from Congress, the quarter ended with Disney laying off 28,000 employees, United and American Airlines firing 38,000 skilled workers and numerous restaurant and retail bankruptcies including Cheesecake Factory and Lord & Taylor. Somewhat ominously, the Federal Reserve, charged with maintaining the safety of our banking system, extended the prohibition on important financial institutions buying in stock or increasing dividends, an indication that regulators want banks to have plenty of surplus cash lying around…just in case. Clearly, those with their fingers on the pulse of the economy feel the recovery is fragile.
Energy Pipelines remain attractive
Energy was the worst performing sector for the quarter, down 22%, and so far, this year, down over 50%. Due to Covid measures, there is a slump in miles driven, miles flown and consumption by sea-going transport, especially cruise ships. At the same time, the world is awash with hydrocarbons. Discipline among international producers and the decision to shut off many producing wells managed to keep oil inventories manageable, and prices above $40 a barrel, a level that none-the-less is below the cost of production in many shale producing regions of the U.S. There is little doubt that we are about to see a wave of bankruptcies and mergers in the oil patch, the second depression in six years for the industry.
Clients still have some energy industry exposure in the form of preferred and common stock in energy transportation companies, but not in the drilling and producing side of the business. Pipelines are the most efficient and safest way to move oil and gas[1], and our nation is crisscrossed with thousands of these subterranean highways. Pipeline companies are utilities, like electricity carriers. Yet investors have confused energy carriers with oil and gas drilling outfits, resulting in unjustifiably depressed prices for pipeline and storage companies. Reading the balance sheets for two favorites, Enterprise Product Partners and Energy Transfer partners, these pipeline companies have the capacity to remain solvent for many years and are in fact profitable even in the current environment. They are terrific dividend payers, too.
Bonds and Fixed Income Investments
The Fixed income portion of client portfolios has been supportive for our balanced accounts this year, with credit due to the Fed for reassuring a frightened market back in March. The Fed has maneuvered interest rates to record lows in the hope of keeping borrowing going and to help debtors refinance at low rates. This has been great for housing, for example (see discussion below) but leaves fixed income investors in a quandary. At these historic low interest rates, it is difficult to get excited about traditional fixed income investments like bonds. To earn better than the paltry 2% to 3% returns on quality issues, it takes a further drop for interest rates in general. That is because when interest rates fall, previously issued bonds with higher yields increase in price. While people have been saying this for over a decade, it remains true- the chance of a further drop for interest rates appears remote. Without such a drop, bond investors will earn only their stated yield without hope of a bonus capital gain to improve total return. Preferred stocks have been salted into client portfolios for over a decade and the results have been most satisfying. However, they too are becoming less inviting. Not long ago I could find preferred stocks from a quality issuer like Public Storage with 6% yields. Those have all been called back by the company which can now borrow at rates below 5%.
Housing may drive the recovery
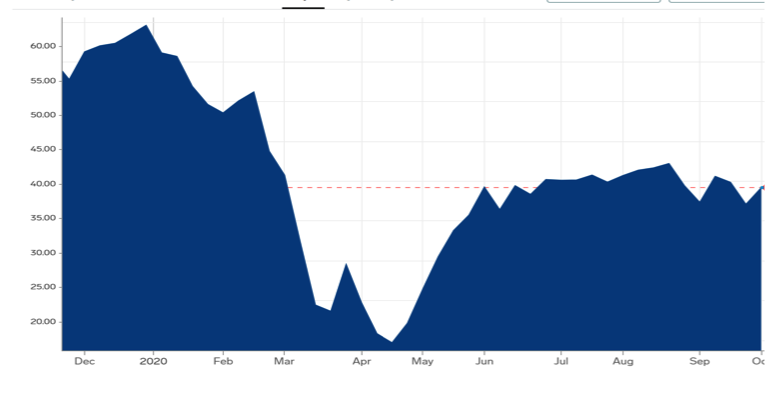
As noted last quarter, rather than the market plunging and staying down, we’ve had the beginnings of a hoped for “V” shaped recovery (see Chart 2) and this has been especially apparent for stocks. While the earliest part of the recovery appeared in “stay-at-home” companies, mostly in technology, there has been impressive strength this past quarter in housing related companies: builders, coatings, hardware.
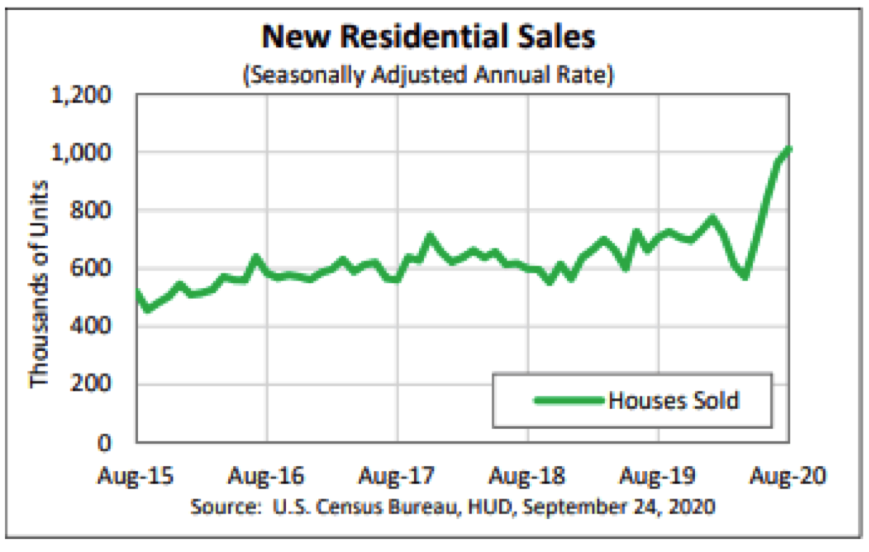
New home sales popped in August, at an annual pace of 1,000,000, a pace not seen since 2006. In early 2017, I positioned certain clients for what was an expected boom in housing demand. That was too early. Now, however, the Millennial generation (born between 1985 and 2000) seem to be having an effect on the housing market. The long-awaited migration of Millennial families to the suburbs seems to have accelerated with the Covid Crisis, and with historically low mortgage rates. Also, aging Baby Boomers may be re-thinking the desirability of life in the city or even of life in senior apartment communities, suggesting another source of demand for affordable suburban housing. I believe housing and related industries will pull us out of our current doldrums, just as did shale oil drilling did after the Great Recession.
Some other sectors of real estate are getting more interesting. We are again moving into high yielding REITS (real estate investment trusts), but not into those specializing in commercial property, offices or apartments. Rather, I like two companies right now warehouse/logistics company Prologis (PLD) is enjoying burgeoning demand from the online economy, something destined to carry for many years. While retail shopping malls struggle with failing tenants, warehousing and transshipment centers are benefiting from the shift to online shopping. Prologis is a more conservative way to play the online shopping phenomena than by going directly into online companies like Amazon, Walmart or Etsy. Their 3% plus dividend is relatively attractive and should mean more stable performance than direct ownership of online marketers. As for personal storage, I like Public Storage (PSA). The company has astute financial management and is growing by acquiring mom-and-pop storage properties from retiring Baby Boomers. It also offers a dividend over 3%, one that has been raised every year for two decades.
Do we have a speculative market?
Speculation is appearing in stocks and bonds. Margin debt levels, for example, are nearly back to pre-Covid levels. As yields on securities fall to record lows, certain investors have walked onto the skinny branches of speculation. First there is the “Robinhood” phenomena. Millennial investors, those in their late ‘20’s and 30’s are tip-toeing into stock investing using companies that allow them to invest small amounts and own slices of companies sporting relatively high share prices. Newbie investors can buy in increments as small as $5.00 and not pay a commission[2]. Some observers suggest the near-vertical rise of well known technology names (Facebook, Apple, Amazon, Netflix, Snap) at the beginning of the quarter was due to indiscriminate buying by neophytes.
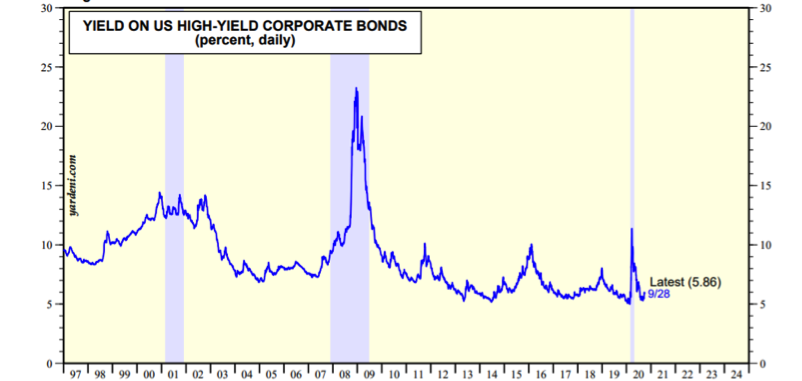
Bond buying has been aggressive as institutional buyers, like insurance companies and pension funds, stretch for yield. Smaller investor, especially retirees are likely taking a greater risk than necessary to improve yield. For example, in the fixed income space, yields for owning high yield bonds are near the worst in history:
Further, the ratings agencies, who remain suspect (to me) due to the poor job they did leading up to the Great Recession, may have not properly re-rated bond issuers in the oil patch nor in travel and leisure. Some are expressing worry that exchange traded funds of junk bonds are replete with mis-rated bonds, and that unpleasant surprises lurk in those funds.
Another speculative indicator: the recent of popularity of so – called “blank check” companies. Also known as “Special Purpose Acquisition Companies”, SPACs are generally formed by sponsors, with expertise (alleged) in a particular industry or business sector, with the intention of pursuing deals in that area. In raising money for a new SPAC, the founders sometimes have at least one acquisition target in mind, but they don’t identify that target to avoid extensive disclosures during the IPO process. (This is why they are called “blank check companies.”) Investors have no sure idea how their money will ultimately be deployed.
I’ve been around the investment world for over four decades now and the “SPAC” frenzy strikes me as evidence that there is far too much speculative money floating around looking for a home. Wall Street is infamous for creating vehicles to attract speculative investors looking for the Big Score. These “trust me” SPAC’s appear to be of that ilk. They are introduced by dropping impressive names as “advisors.” I’m sure some of the sponsors (who stand to earn substantial fees) have been told which companies are to be targeted for takeover. Yet Joe Average likely has little idea – only that some “smart guys” are running the show. It’s bad enough that the vast majority of retail investors buy companies they barely understand but piling into the SPAC space strikes me as evidence that a new crop of suckers is going to get “schooled.”
Out of Gold, for now
Last year I put many clients in a small gold position as the dollar weakened-that’s usually the source of gold’s price rallies. This rally was signaled by the ability of the metal to punch above many years of hitting a price ceiling near $1,300 per troy ounce. The chart below shows pricing for a liquid exchange traded fund that closely follows the price of the metal. The SPDR Gold Shares ETF (GLD) trades on the New York Stock Exchange and prices its shares at one tenth the price of physical metal, thus the price scale seen on either side of the chart. This chart is known as a “point and figure” chart, a way of looking at securities and commodities that clarifies and alerts us to significant trend changes. An “X” is recorded each time the share price rises to a new price point. An “O” goes in when a price moves in the opposite direction. By setting the required price movement correctly the chart screens out some of the day-to-day “noise.”
In the chart below, each square indicates a two dollar change from the square immediately below or above it. Only when the price of GLD changes by $2.00 or more does a new square get filled in.
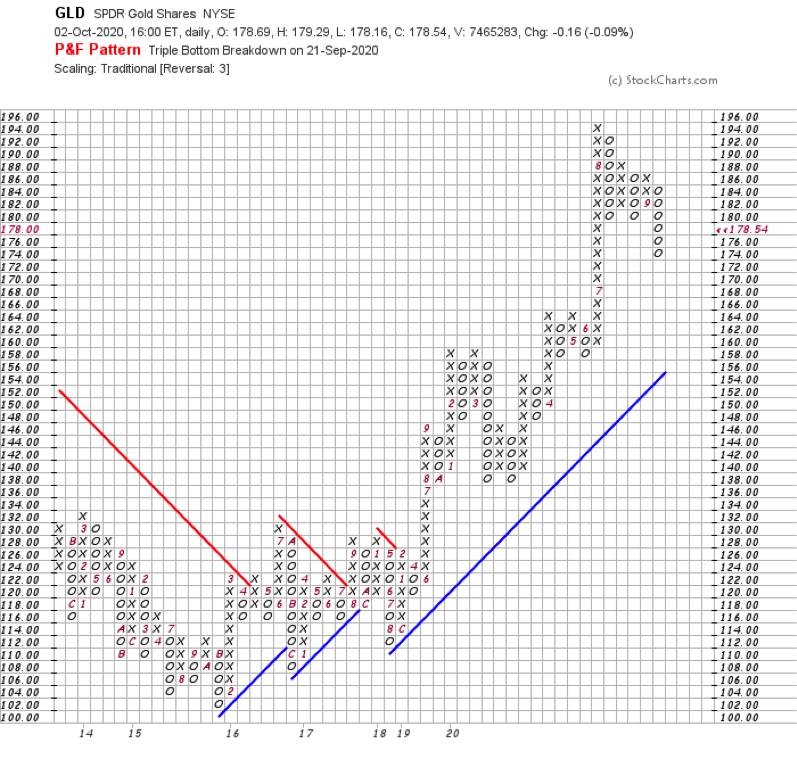
As you can see, in early 2019, the price of this fund (GLD is this fund’s symbol) rose above $130 level for the first time in five years. This is meaningful and usually signals further price increases. We began buying in July 2019 shortly after this signal. Over the next 13 months, the price of GLD has gone from $130 ($1,300 per troy ounce) to $190 ($1,900 per troy ounce), nearly a 50% price increase.
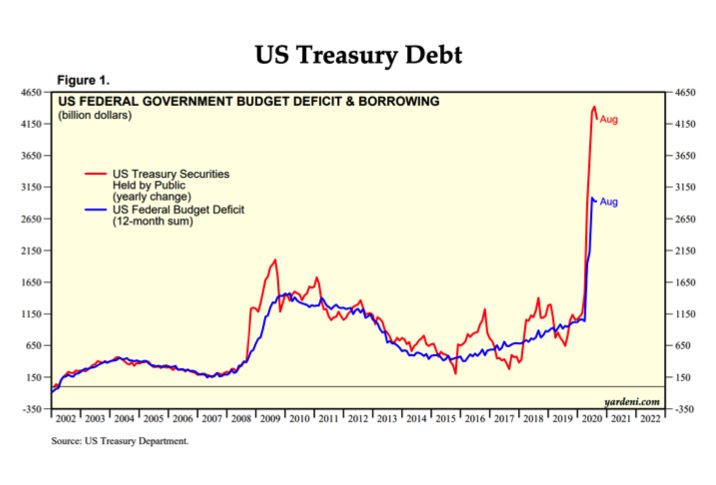
Recently, when the stock fell below support at $180, I felt that the considerable profit clients had built up was at risk and jumped out. As a long- time chart reader, my guess is that we will not take another look until the price of GLD further weakens to about $160 . That would be about a 40% to 50% retracement of the bullish move, a frequent behavioral pattern. Long term, I suspect the US dollar is headed for a secular decline. There are many complex factors affecting the value of a currency. The U.S. dollar has been king for over a century. A century ago, it was backed by gold and the nation ran a balanced budget. But history is not kind to nations that fall deeply into debt (see chart below). I have to believe that barring an unlikely return to fiscal discipline by our Federal government, the dollar is headed lower. which will again make gold an attractive parking spot. We watch and wait and pray for our country.
In a later post, I’ll offer some thoughts about financial implications for various election outcomes. Until then, here’s hoping these observations and thoughts serve you well!
Gary Miller
[1] Safer than moving oil or gas by truck or rail. I’m disturbed by so-called environmentalists who fight pipelines tooth-and-nail, leaving cities and towns vulnerable to other forms of energy transport above ground.
[2] The sponsoring companies earn income from “order flow.”