This was one of the best quarters and is one of he best half-years for our Balanced-Value style of investing that I can recall in our 13+ year history. Most client accounts will see a half year cash flow adjusted increase in the range of 7% to 10%, topping the performance of broad stock and bond indices. Our superior performance was driven by a relatively heavy weighting to the energy industry which had been under market suspicion until things began to unravel in Iraq in June. An ocean of new oil is being produced in North America with more to come, and as with natural gas, there is worry that oil prices may become depressed for a time by surplus. However, the unexpected sweep by extremist Muslims into Northern Iraq seems to have driven investors to buy energy companies, despite little movement in the benchmark Brent Crude price. Since our approach to energy is dominated by ownership of pipelines, and because these stocks are in high demand for their dividends, our clients enjoyed a double barreled lift to their portfolios as both energy and utilities were among the strongest performing sectors in the past quarter.
The quarter's performance was aided by new price highs for a number of our holdings.
The Fixed Income Story
Meanwhile, surprising the consensus, including me, was the strong showing of bonds as interest rates stubbornly refuse to rise, even after five years of economic recovery. I reduced bond holdings a year or so ago in the face of the first significant correction in bond prices in five years. At the time it appeared the long predicted turn for interest rates was upon us. Not so. Rates have backed off and we now know that a weak first quarter's economic activity was a factor. Meanwhile inflation remains subdued. Our clients have a significant allocation to fixed income vehicles, which include preferred stock, some of which sport yields over 6%.
There are some who believe interest rates may stay low for years, if not decades, and that includes bond guru Bill Gross of PIMCO. While he attributes this to a sluggish economy, I am in the camp that attributes the "low-is-likely" scenario to demographics. Retirees naturally allocate a larger portion of their liquid wealth to bonds and CD's than do younger investors. As you have likely heard ad nauseam, the Boomer generation, nearly 20% of our population and far larger in terms of economic clout, is aging into retirement (10,000 turn 65 each day). This suggests that safety-seeking retirees will continue to supply corporate and government borrowers with ample liquidity. High demand for bonds equals lower interest rates.
Is the Market at a Dangerous Topping Point?
I've disclaimed any ability to call "the Market" for years in this blog and in the newsletters we occasionally publish. Yet it is disingenuous to say I have no opinion on the market and simply buy shares and bonds when they are undervalued.
I find myself agreeing with those who feel that the equities markets are fully valued. Yet with corporate balance sheets healthy, with our nation enjoying the positive ripple effect of growing American energy independence and rising productivity, with interest rates remaining low and the likelihood that foreign demand for American products will rise in the coming months, I cannot believe we are at the top of this market move. Certainly a healthy correction would not be a surprise, but "game over"? I don't think so.
Is a Blow-off Leg Next?
Equities markets usually end in an orgy of euphoria, with high levels of margin debt, many initial public offerings of dubious businesses and a feeling that the economy has entered a new day, a sustainable expansion engineered by the best financial minds on Wall Street and similar B.S. (that stands for "Bullish Sentiment, what else?)!
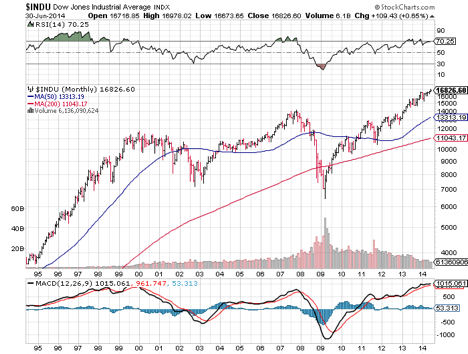
While the business media has been saluting the fact that broad American stock indexes have been repeatedly reaching "all time highs" for over a year, let's recall that the Dow Jones industrial average is a index that reflects a total dollar value for a collection of 30 stocks that are considered representative of the American economy. Consider that the Dow reached an all-time high of approximately 11,500 just before the Tech Bubble popped, taking the Dow down some 40% (NASDAQ suffered far greater losses). Then came the inevitable recovery during first years of this century until the markets again peaked out in October 2007 with the Dow topping the 14,000 mark, "a new all time high." This was followed by the historic financial meltdown sparked by a collapsing mortgage market that saw half the Dow's value disappear in the following fourteen months. As the chart above shows, it was another five years and more before Dow regained the 14,000 mark and it has since gone higher.
Consider, however, that between October 2007 and June 2014 with inflation tracking just above 2%. The Dow would have to reach a level of about 16,700 to regain the October 2007 level in "real" dollars. This principal applies to the 1999 market peak as well, as the following chart illustrates:
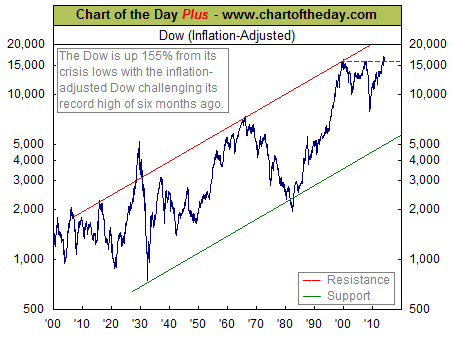
Over the years I have paid attention to inflation adjusted stock indexes. I believe they tell the real story of what is happening in the markets. This chart is about a month old. The chart seems to be saying that the market has perhaps penetrated to a new all time "real" high, after twice before failing to do so. I'd like to see it advance further before I'll be more convinced, but given the lack of other signals of a top, we may indeed be on the threshold of seeing a true, inflation adjusted all time high for stock prices! Now this is all technician talk, but when any entity, stock, bond or commodity is able to penetrate previous tops, also known as "resistance" that's usually a meaningful signal of further advances to come.
We do not invest based on charts but they do inform the total input that leads to buy and sell decisions for clients. Charts aside, much money remains on the sidelines hiding in low yielding CD's and money funds and much fear dwells in the hearts of retail investors while slack remains in the economy. In other words, the economy is showing no signs of a top, investors have plenty of dry powder, so why should this bull market top out now?
Normally, the last leg of a bull market features a stampede by Johnnie-Come-Latelies who have sat out a bull market and can no longer stand to miss the action. It's when this greed mentality takes hold that I become worried. I'm not seeing much of this. Putting it all together, I suspect we have a good deal more upside to enjoy in equities.
Gary E Miller, CFP