“ October 9, 2007: U.S. Equities reach all all-time high as housing slumps”
This could have been the headline. With hindsight, we know that over the following 18 months the U.S. and world economies entered one of the most perilous episodes in economic history. A liquidity crisis engulfed major money center banks, well known insurance giants like AIG had to be saved by government bailouts, and widely held financial assets, especially stocks and real estate collapsed in value.
Some investors ran for the hills, many lost their homes. College plans were shelved and those about to retire would find themselves working for many more years.
It is instructive to see how major asset classes have fared during the crisis and in the decade that has followed. You will likely agree that a well diversified portfolio was helpful in reducing volatility especially during the months leading into the Great Recession. By designing a portfolio to reduce downside shocks, clients are better able to withstand the emotions that mayt lead to poor decisions (i.e. panic selling at a market bottom). Time is a great healer in the financial world, and the past ten years bear this out.
Gold: Up about $500/troy ounce or 75% or approximately 5.10% growth per year
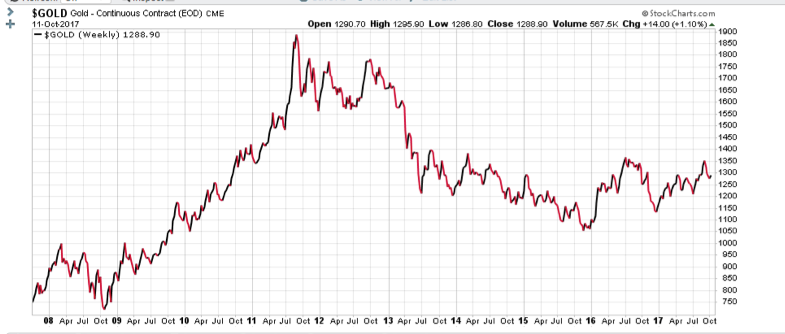
Source: Stockcharts.com
Residential Real Estate, USA: Up about 10% or about .557% per year*
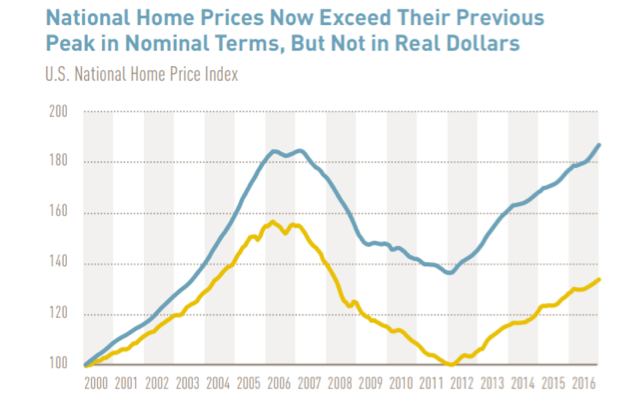
Residential Real Estate, USA: Up about 10% or about .557% per year*
Equities (Stocks) USA: (Standard & Poor’s 500) up about 73% or 7.44% per year*
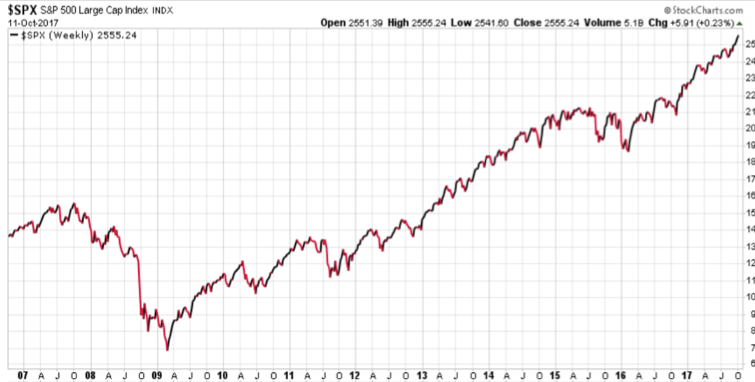
*5.65%/year plus dividends
Source: Morningstar.com and Stockcharts.com
International Equities, About down 1.05% or, with dividends included, +1.12% per year
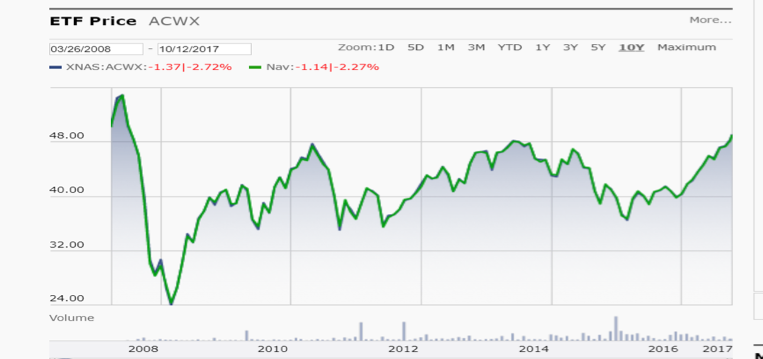
Source Morningstar.com. MSCI World Index ex U.S. Note that this index, heavy in financial companies, cratered by 55% from the October 2007 peak to the nadir February 29, 2009
U.S. Ten Year Bond Price up approximately 15%. Including interest, up 4.5% per year
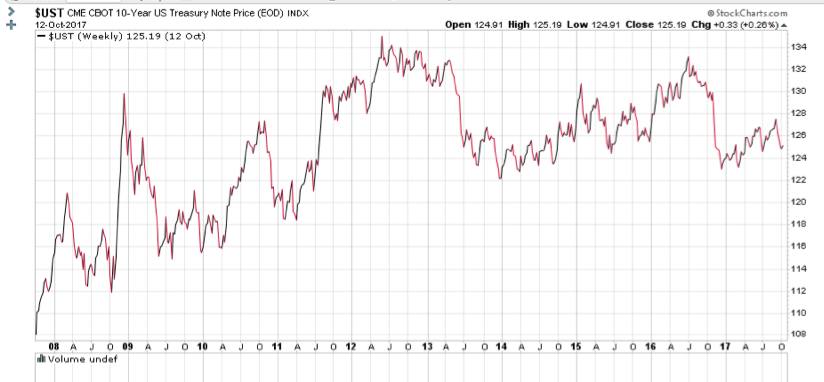
NOTE: SELECTIVITY WAS KEY. LOW QUALITY JUNK BONDS AND MORTGAGE BACKED BONDS FELL SHARPLY IN VALUE OR DEFAULTED.